The Fivetran Platform Connector provides users visibility into how their Fivetran account is used.
The Platform Connector is a free connector that doesn’t count toward your monthly active rows (MAR). Log insights are especially valuable for large enterprises that are managing hundreds of users and thousands of pipelines as manual monitoring is time consuming and doesn’t scale.
Our log records events including sync statistics, user activities on each connector and detailed sync information. Your developers, system administrators and security professionals can then use this information to understand how Fivetran is performing and to identify any errors for troubleshooting.
With this visibility, you can monitor your instance performance, identify optimizations and control your data integration costs and introduce new efficiencies.
In this blog, I’ll share how we use our Platform Connector at Fivetran to monitor the performance of our own demo account.
In other words, here’s how Fivetran uses one of our very own connectors to automate our everyday roles.
What to know about the Fivetran demo account
First some context on the account we’re discussing and how we use it.
At Fivetran, we have a dedicated account for running our product demos. This account uses our production infrastructure and code, so our demonstrations reflect an accurate environment using our real Fivetran infrastructure.
This demo account is shared with our technical and sales teams and thus, has high traffic. We’ve preconfigured a few demo connectors and destinations, but users are always allowed to add or modify anything as needed for demo purposes.
How we upkeep our demo account’s hygiene
To prevent us from accruing unnecessary infrastructure and warehouse costs, we regularly clean up the environment using automated scripts. This cleanup allows us to preserve the aesthetics and structure of the environment and continue effective demos. This also means that what we’ve preconfigured stays functional.
Keeping a clean Fivetran account is good practice for controlling what data is entering your destinations — whether your motivation is cost savings or governance.
For our demo account, we have the following guidelines or policies:
- Maintain a fixed number of connectors that are always available
- Pause new connectors after one day
- Paused connectors are deleted after one week
As our cleaning automations run, we track the following to ensure the scripts are working properly:
- Number of Active Connectors
- Number of Paused Connectors
- Connector Up Time
Additionally, we want to track trends in our environment to determine where the majority of our data volume comes from, what errors are occurring and where those errors are occurring.
With that in mind, we look at the following:
- Data volume per Connector
- Number of connectors created per user
- Errors
- Errors by connector/destinations
Setting up the Platform Connector for our environment
The Fivetran Platform Connector exposes the information we require and we utilize that information to create a dashboard to automate our monitoring efforts.
Creating a Destination
We start with creating a Destination in Fivetran. Our demo environment consists of nine destinations strictly used for demos.
We want to set up the Platform Connector in a location where users won’t accidentally modify or delete it. We also want to write the data to a specific location in our data warehouse.
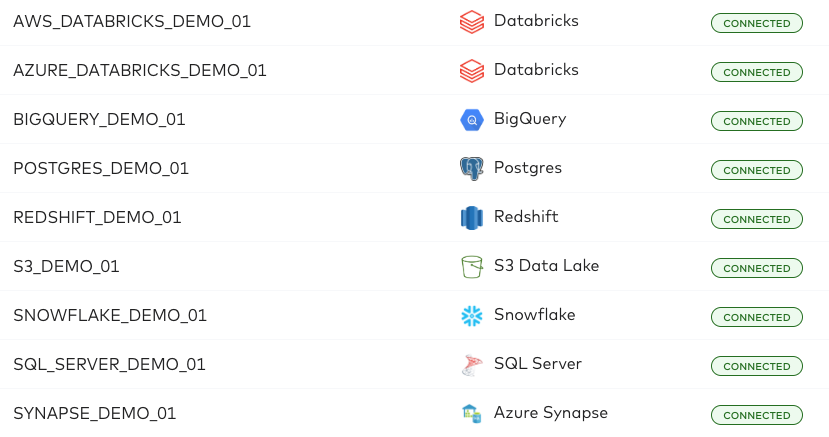
I’ll first create a new destination just for monitoring our account, which we’ll call ACCOUNT_MONITORING. You’ll also notice that we’re writing to a dedicated database FIVETRAN_SALES_DEMO_MONITORING which isolates our monitoring data from our demo data.
.png)
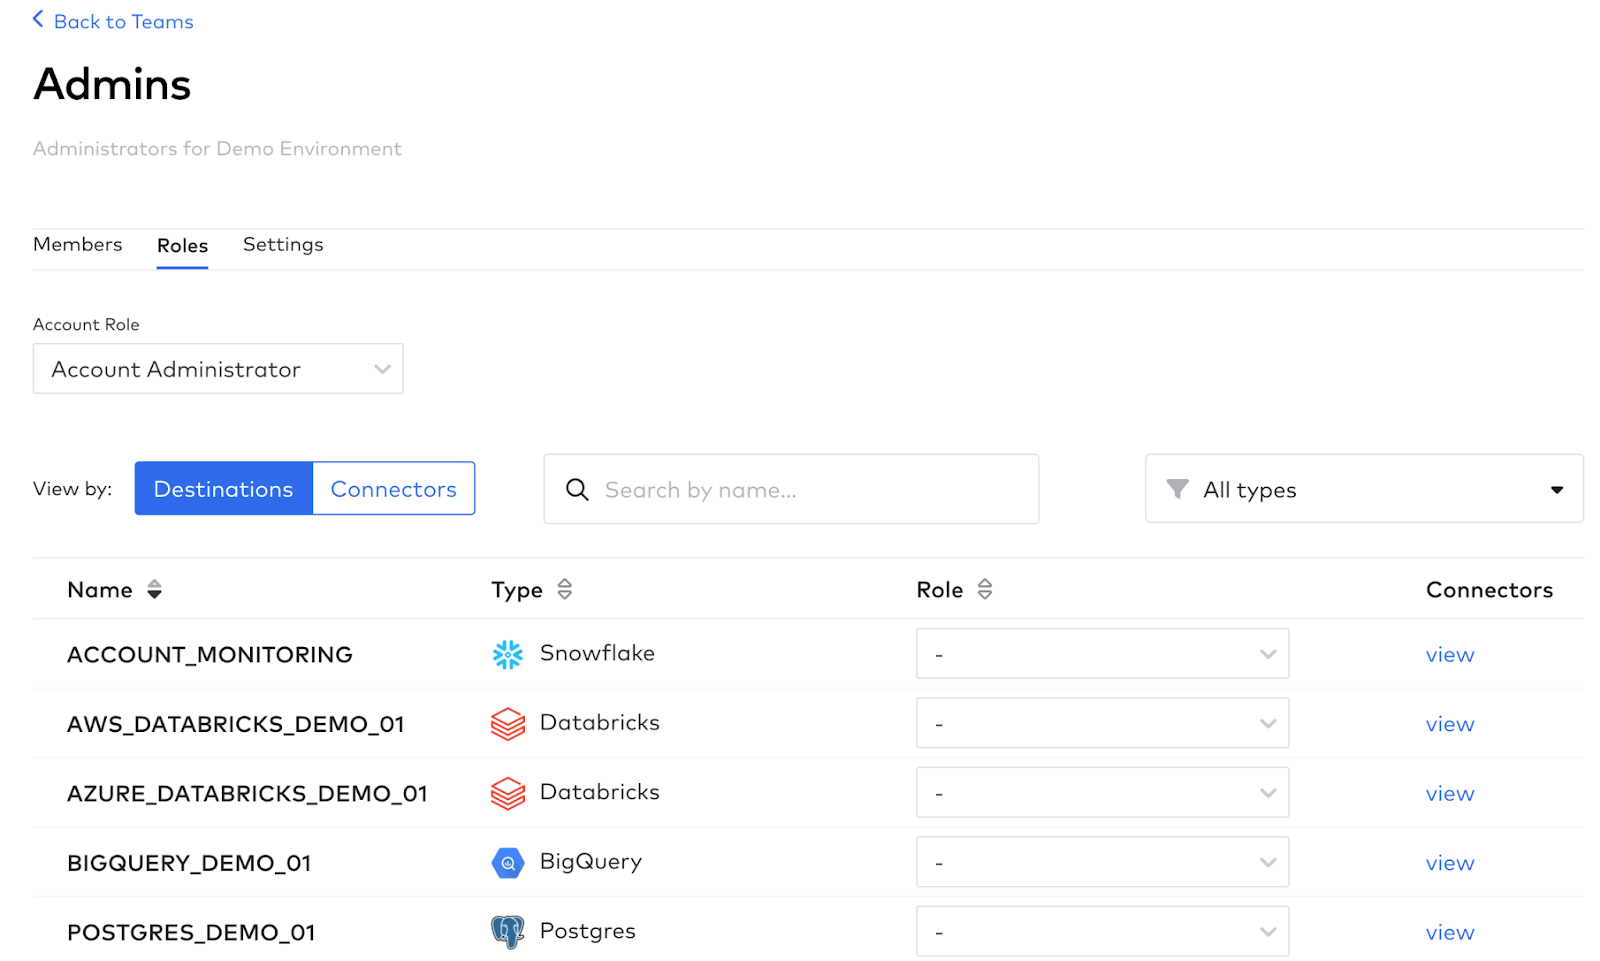
We leverage Role Based Access Controls to restrict access to the destination to only our Account Admins. Our Admin Team has an Account Level role: Account Administrator, which is inherited by all the destinations.
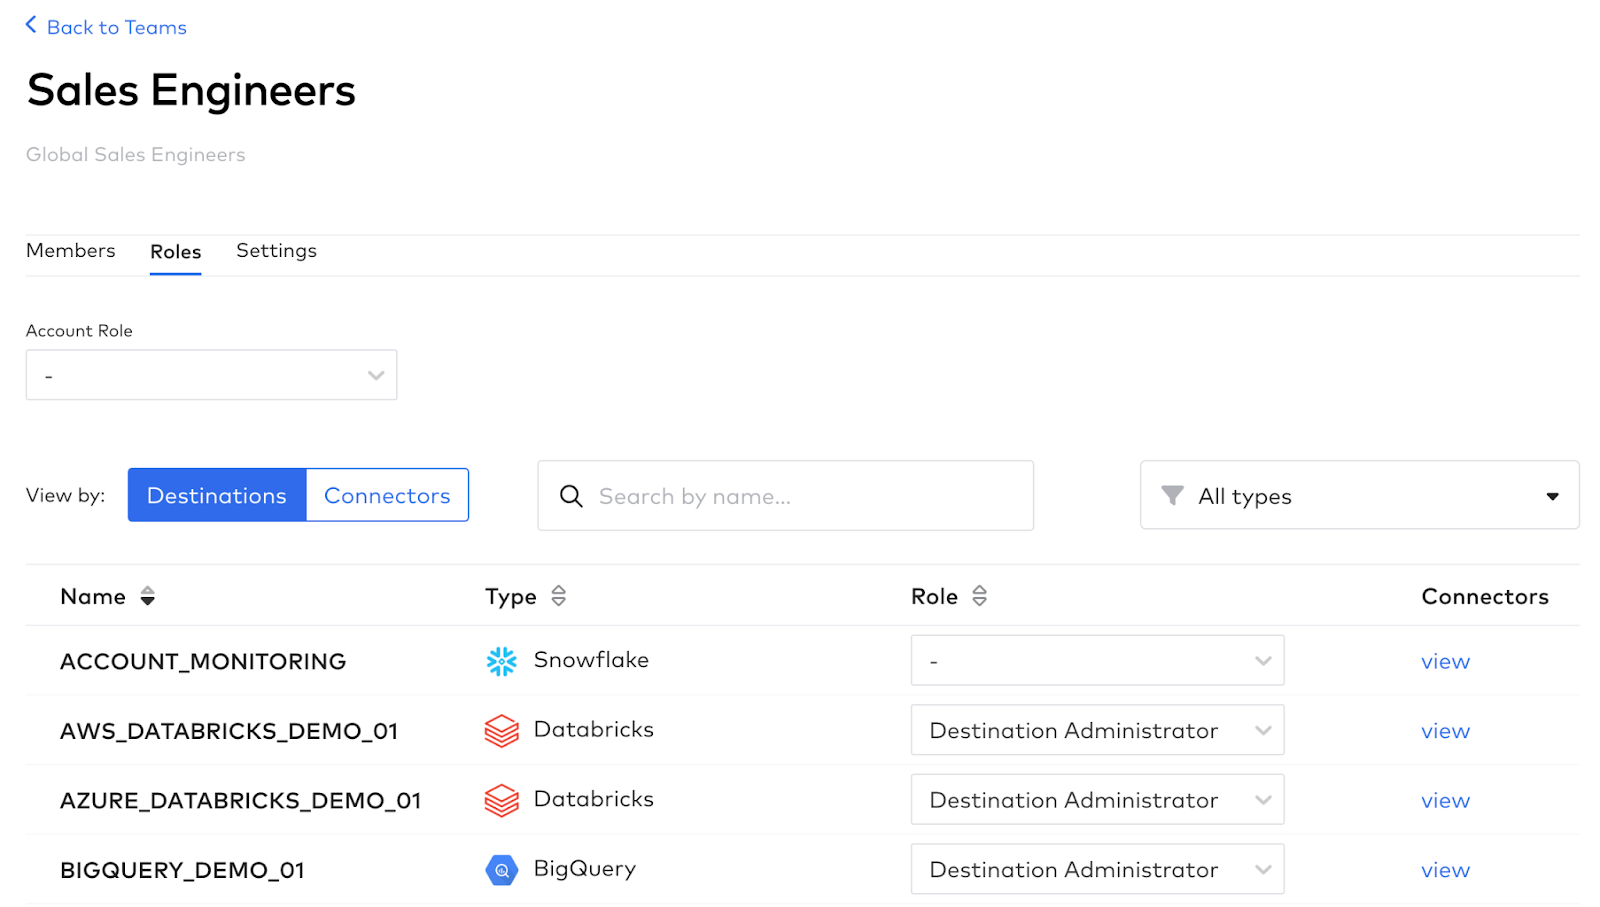
If you compare this to the Sales Engineers Team, they have no account-level role. Instead, they have individually assigned destination-level roles with certain destinations like ACCOUNT_MONITORING excluded from their access.
Creating the Platform Connector
We then create a Fivetran Platform Connector in this destination and enable the connector at the account level.
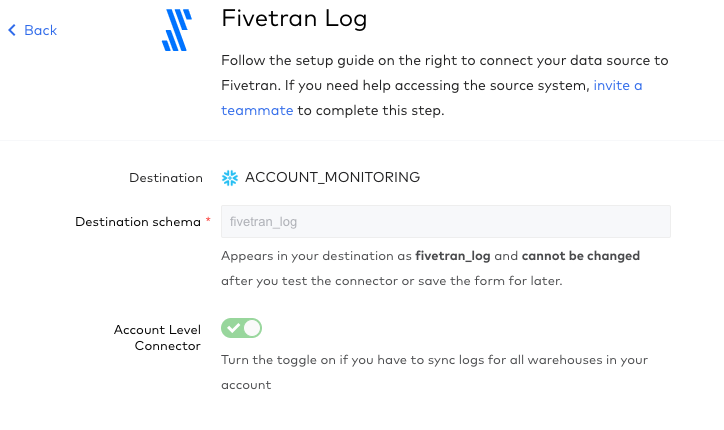
An account level Fivetran Platform Connector pulls information from all configured destinations and connectors in the account, rather than just the particular destination where the connector is created.
After that, we kicked off the sync. (Remember, the data loaded by the Platform Connectors doesn’t count toward your MAR consumption!)
Fivetran will load all the log data that’s available to the selected destination. In this case, we are loading data to our Snowflake database FIVETRAN_SALES_DEMO_MONTIORING, in a schema that has the same name as our connector, which we called fivetran_log. To see what tables are going to load, and how they’re related, you can look at our ERD.
Transforming data for visualization
Once we have our data fully loaded, we start modeling the data to get the metrics we want to track. Fivetran has created sample queries with pre-written SQL for common uses including:
- MAR details
- Pipeline performance
- Modified record monitoring
- Connector behavior
- Destination details
You can use these SQL statements in your transformation tooling of choice. In our case, we’ve decided to use our dbt integration to run all of the transformations.
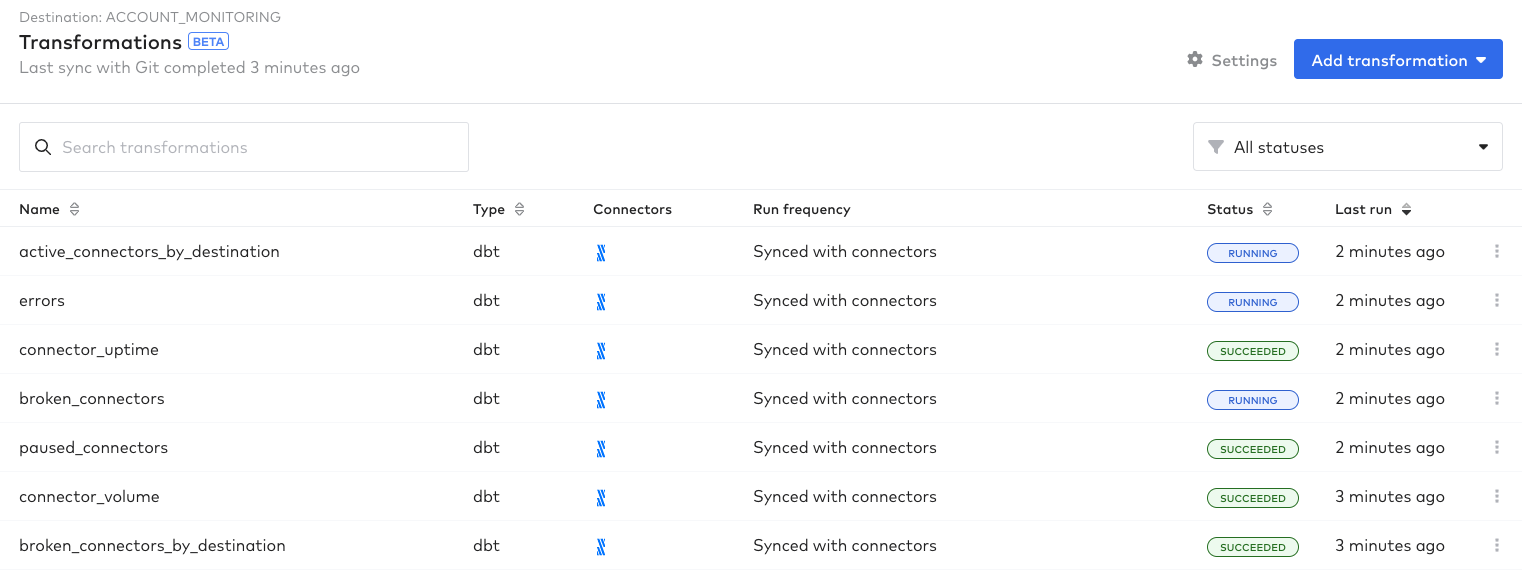
As part of our transformation setup, we’ve enabled the jobs to run immediately after the connector finishes syncing using Integrated Scheduling. This ensures that our dashboard is up to date with the latest data as soon as it’s loaded by Fivetran.
Building a monitoring dashboard
For our business intelligence (BI) tool, we decided to go with Sigma, but any BI tool that’s compatible with your data warehouse is viable.
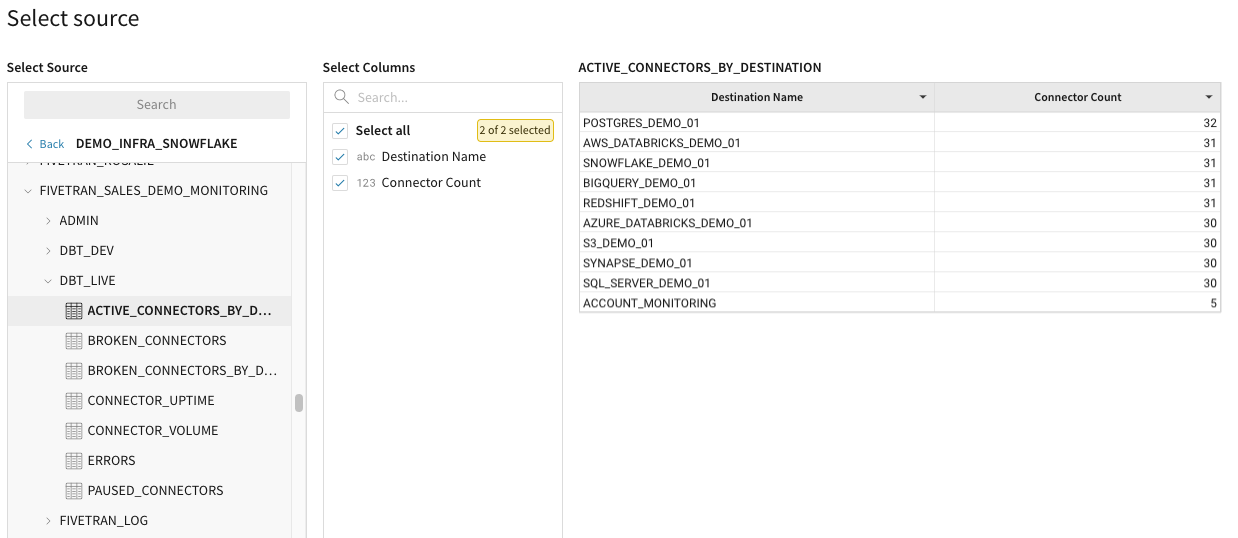
In Sigma, we have a workspace for all of our monitoring dashboards. We avoid creating transformations in Sigma, or modifying any data, since we want to keep all transformations in one place (our dbt repository in GitHub). So in Sigma we can just select the option to create a visualization from a Table or View.
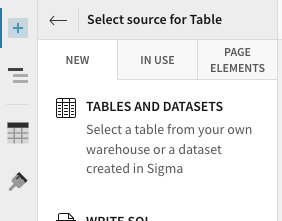
Using our transformed data, we can select sources to create a new dashboard in that space and proceed to add visualizations in the form of bar charts and tables based on the transformed tables.
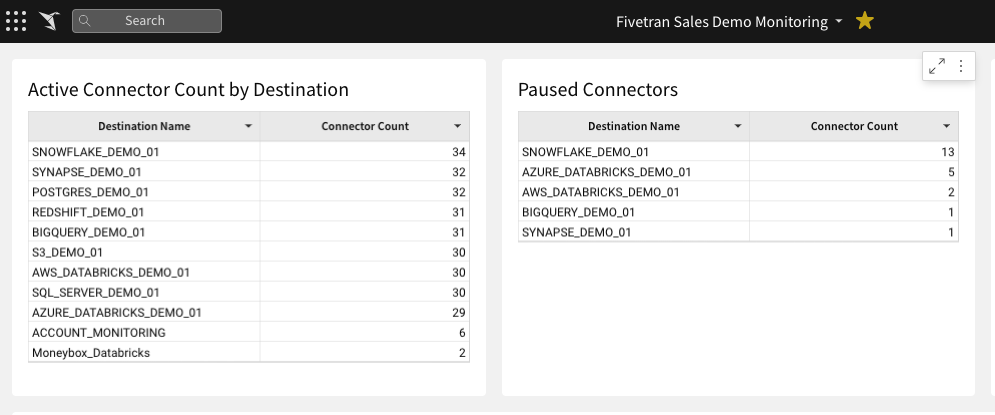
Active connector count by destination
In the visualization below, we track how many active connectors are present in each of our demo destinations. This lets us understand which destinations are the most utilized for demos, which helps us figure out if we need to adjust our destinations' compute to handle the additional load.
Additionally, if we’re seeing the connector count spike, it means our clean-up automations aren’t working as expected — which is also why we track paused connectors.
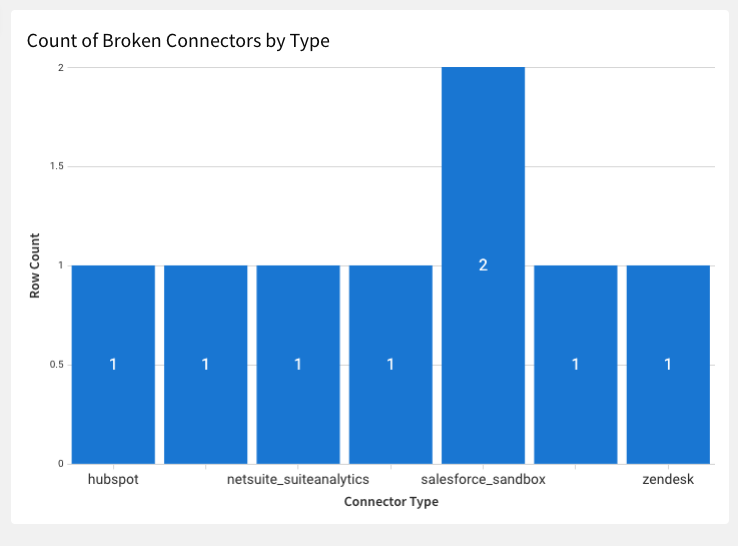
Count of broken connectors by type
We’ve also grouped the broken connector count by type of connector. In doing so, we can understand if there are problematic sources.
For instance, every quarter we refresh our Salesforce Sandbox environment, which results in broken Salesforce Sandbox connectors because the authentication token of our demo user is reset.
The final step we take is to schedule a post to our team Slack channel on a daily basis. So first in the morning, we’re greeted with a message that contains our monitoring dashboard. We can then proceed to determine if anything needs attention.
Summary
We have a large demo environment used by over 400 users who are running demos every day, creating connectors every day and making changes on the fly as demos demand. This high volume, high activity account requires effective and efficient management to avoid complicating the everyday work of our technical and sales teams.
Creating an overview dashboard built on the data provided by the Fivetran Platform Connector lets us see what needs attention — and enables us to identify patterns in problematic sources, heavy load and unusual user behavior.
It’s an integral part of our continued usage of our Fivetran demo account and ensures we have extended visibility into how users utilize Fivetran — for Fivetran.
We don’t just talk the talk, we walk the walk — and that’s a bit of a glimpse into how Fivetran uses Fivetran.
[CTA_MODULE]


 (1).png)


.svg)
.svg)
.svg)